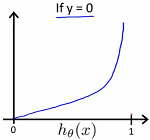
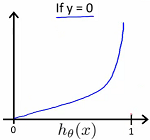
class: title-slide .row[ .col-7[ .title[ # Logistic Regression ] .subtitle[ ## Logistic regression ] .author[ ### Laxmikant Soni <br> [Web-Site](https://laxmikants.github.io) <br> [<i class="fab fa-github"></i>](https://github.com/laxmiaknts) [<i class="fab fa-twitter"></i>](https://twitter.com/laxmikantsoni09) ] .affiliation[ ] ] .col-5[ .logo[ <img src="figures/rmarkdown.png" width="281" /> ] ] ] --- class: very-large-body # Logistic Regression .pull-top[ Logistic regression is an approach to classification problems. Instead of our output vector y being a continuous range of values, it will only be 0 or 1 ie `\(y \in [0,1]\)` Where 0 is usually taken as the “negative class” and 1 as the “positive class”, but you are free to assign any representation to it. One method is to use linear regression and map all predictions greater than 0.5 as a 1 and all less than 0.5 as a 0. This method doesn’t work well because classification is not actually a linear function. ] --- class: large-body # Hypothesis function .pull-top[ Our hypothesis should satisfy: `\(0 \leq h_\theta (x) \leq 1\)` Our new form uses the “Sigmoid Function,” also called the “Logistic Function”: `\(h_\theta (x) = g(\theta^T x)\)`, `\(z = \theta^T x\)` , `\(g(z) = \frac {1}{1 + e^{-z}}\)`  The function g(z), shown here, maps any real number to the (0, 1) interval, making it useful for transforming an arbitrary-valued function into a function better suited for classification. We start with our old hypothesis (linear regression), except that we want to restrict the range to 0 and 1. This is accomplished by plugging `\(\theta^T x\)` into the Logistic Function. `\(h_\theta\)` will give us the probability that our output is 1. `\(h_\theta(x) = P(y=1|x;\theta) = 1 - P(y = 0|x;\theta)\)` `\(P(y = 0 | x; \theta) + P(y=1|x;\theta) = 1\)` ] --- class: large-body # Decision Boundray .pull-top[ In order to get our discrete 0 or 1 classification, we can translate the output of the hypothesis function as follows: `\(h_\theta(x) \geq 0.5 \rightarrow y = 1\)` `\(h_\theta(x) < 0.5 \rightarrow y = 0\)` The way our logistic function g behaves is that when its input is greater than or equal to zero, its output is greater than or equal to 0.5: `\(g(z) \geq 0.5\)` `\(when \ z \geq 0\)` `\(z = 0, e^0 = 1 \rightarrow g(z) = \frac{1}{2}\)` `\(z \rightarrow \infty , e^{\neg \infty} \rightarrow 0 \rightarrow g(z) = 1\)` `\(z \rightarrow \neg \infty , e^{ \infty} \rightarrow \infty \rightarrow g(z) = 0\)` So if our input to g is `\(\theta^T X\)` then that means `\(h_\theta (x) = g(\theta^T x) \geq 0.5\)` `\(when \ \theta^T x \geq 0\)` ] --- class: large-body # Decision Boundray .pull-top[ From these statements we can now say: `\(\theta^T x \geq 0 \rightarrow y = 1\)` `\(\theta^T x \leq \rightarrow = 0\)` The decision boundary is the line that separates the area where y = 0 and where y = 1. It is created by our hypothesis function. Example: `\(\left [\matrix {5 \\ \neg 1 \\ 0} \right ]\)` `\(y = 1 \ if \ 5 + (-1)x_1 + 0x_2 \geq 0\)` `\(5 - x_1 \geq 0\)` `\(-x_1 \geq -5\)` `\(x_1 \geq 5\)` In this case, our decision boundary is a straight vertical line placed on the graph where x1=5, and everything to the left of that denotes y = 1, while everything to the right denotes y = 0. Again, the input to the sigmoid function g(z) doesn’t need to be linear, and could be a function that describes a circle (e.g. `\(z = \theta_0 + \theta_1 x_1^2 + \theta_2 x_2^2\)` or any shape to fit our data. ] --- class: large-body # Cost Function .pull-top[ We cannot use the same cost function that we use for linear regression because the Logistic Function will cause the output to be wavy, causing many local optima. In other words, it will not be a convex function. Instead, our cost function for logistic regression looks like: `\(J (\theta) = \frac {1} {m} \sum_{i = 1}^{m} Cost(h_\theta(x^{(ij)}), y^{(ij)})\)` `\(Cost(h_\theta (x), y) = -log(h_\theta (x)) \ if \ y = 1\)` `\(Cost(h_\theta (x), y) = -log(1 - h_\theta (x)) \ if \ y = 0\)`   ] --- class: large-body # Cost function .pull-top[ For the parameter vector `\(\theta\)`, the cost function is `\(J(\theta) = \frac{1}{2m} \sum_{i=1}^{m} (h_\theta (x_i) - y_i)^2\)` The vectorized version is: `\(J(\theta) = \frac{1}{2m} (X \theta - \bar{y})^T (X \theta - \bar{y})\)` where `\(\bar{y}\)` denotes the vector of all y values ] --- class: large-body # Gradient Descent for Multiple Variables .pull-top[ The gradient descent equation itself is generally the same form; we just have to repeat it for our ‘n’ features: repeat until convergence: `\(\theta_0 := \theta_0 - \alpha \frac{1}{m} \sum_{i = 1}^{m} (h_\theta(x^{(i)}) - y^{(i)}) * x_0^{(i)}\)` `\(\theta_1 := \theta_1 - \alpha \frac{1}{m} \sum_{i = 1}^{m} (h_\theta(x^{(i)}) - y^{(i)}) * x_1^{(i)}\)` `\(\theta_2 := \theta_2 - \alpha \frac{1}{m} \sum_{i = 1}^{m} (h_\theta(x^{(i)}) - y^{(i)}) * x_2^{(i)}\)` In other words: repeat until convergence: { `\(\theta_j := \theta_j - \alpha \frac{1}{m} \sum_{i = 1}^{m} (h_\theta(x^{(i)}) - y^{(i)}) * x_0^{(i)} \ for \ j := 0..n\)` } ] --- class: large-body # Feature normalization .pull-top[ Mean normalization involves subtracting the average value for an input variable from the values for that input variable, resulting in a new average value for the input variable of just zero. To implement both of these techniques, adjust your input values as shown in this formula: `\(x_i := \frac{x_i - \mu_i}{s_i}\)` Where μi is the average of all the values for feature (i) and si is the range of values (max - min), or si is the standard deviation. ] --- class: large-body # Features and polynomial regression .pull-top[ We can improve our features and the form of our hypothesis function in a couple different ways. Our hypothesis function need not be linear (a straight line) if that does not fit the data well. We can change the behavior or curve of our hypothesis function by making it a quadratic, cubic or square root function (or any other form). `\(h_\theta(x) = \theta_0 + \theta_1 x_1 + \theta_2 x_1^2 + \theta_3 x_1^3\)` To make it a square root function, we could do `\(h_\theta(x) = \theta_0 + \theta_1 x_1 + \theta_2 \sqrt{x_1}\)` ] --- class: large-body # Normal Equation .pull-top[ The “Normal Equation” is a method of finding the optimum theta without iteration. `\(\theta = (X^T X)^{-1} X^T y\)` There is no need to do feature scaling with the normal equation. ] --- class: inverse, center, middle # Thanks ---