Clustering
Clustering is Machine Learning method that helps in finding the pattern of similarity and relationships among data samples in dataset and then cluster these samples into various groups.
Clustering
Clustering is Machine Learning method that helps in finding the pattern of similarity and relationships among data samples in dataset and then cluster these samples into various groups.
The clustering algorithm gets raw data and tries to divide it up into clusters . K-Means-Clustering is the method that we are going to use here. Similar to K-Nearest-Neighbors, the K states the amount of clusters we want.
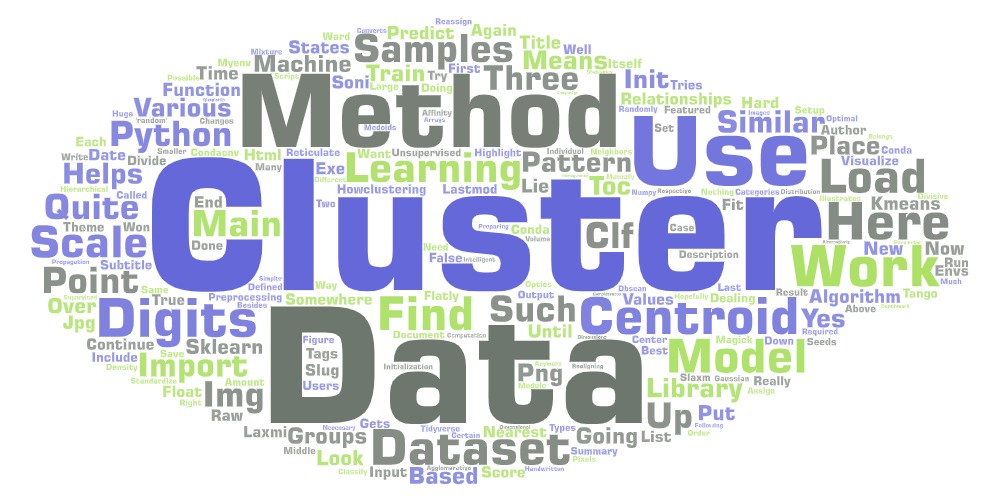
HOW CLUSTERING WORKS
The clustering itself works with so-called centroids . These are the points, which lie in the center of the respective clusters.
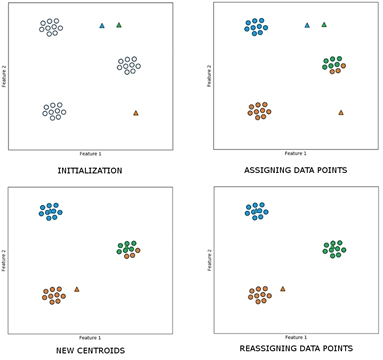
The figure above illustrates quite well how clustering works. First, we randomly place the centroids somewhere in our data. This is the initialization . Here, we have defined three clusters, which is why we also have three centroids.
Then, we look at each individual data point and assign the cluster of the nearest centroid to it. When we have done this, we continue by realigning our centroids. We place them in the middle of all points of their cluster.
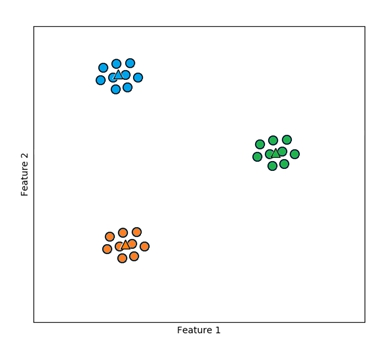
After that, we again reassign the points to the new centroids. We continue doing this over and over again until almost nothing changes anymore. Then we will hopefully end up with the optimal clusters. The result then looks like this:
Types of Clustering methods
• Centroid based methods such as K-means and K-medoids
• Hierarchical clustering methods such as agglomerative and divisive (Ward’s, affinity propagation)
• Distribution based clustering methods such as Gaussian mixture models
• Density based methods such as dbscan and optics.
LOADING DATA
For the clustering algorithm, we will use a dataset of handwritten digits. Since we are using unsupervised learning, we are not going to classify the digits. We are just going to put them into clusters. The following imports are necessary:
from sklearn.cluster import KMeans
from sklearn.preprocessing import scale
from sklearn.datasets import load_digits
Besides the KMeans module and the load_digits dataset, we are also importing the function scale from the preprocessing library. We will use this function for preparing our data.
digits = load_digits()
data = scale(digits.data)
After loading our dataset we use the scale function, to standardize our data. We are dealing with quite large values here and by scaling them down to smaller values we save computation time.
TRAINING AND PREDICTING
We can now train our model in the same way we trained the supervised learning models up until now.
clf = KMeans( n_clusters = 10 , init = 'random' , n_init = 10 )
clf.fit(data)
## KMeans(init='random', n_clusters=10)centroids somewhere. Alternatively, we could use k-means++ for intelligent placing. The last parameter (n_init ) states how many times the algorithm will be run with different centroid seeds to find the best clusters.
Since we are dealing with unsupervised learning here, scoring the model is not really possible. You won’t be able to really score if the model is clustering right or not. We could only benchmark certain statistics like completeness or homogeneity .
What we can do however is to predict which cluster a new input belongs to.
clf.predict([…])
In this case, inputting data might be quite hard, since we would need to manually put in all the pixels. You could either try to write a script what converts images into NumPy arrays or you could work with a much simpler data set.
Also, since we are working with huge dimensions here, visualization is quite hard. When you work with two- or three-dimensional data, you can use the Matplotlib knowledge from volume three, in order to visualize your model.