Data Science
A Data science process is a life cycle process for delivering a data science project that helps a data consumer to gain insights from the data.
Data Science Process?
A Data science process is a life cycle process for delivering a data science project that helps a data consumer to gain insights from the data.
It involves the following steps. They are as follows:
- Describing the data problem by asking the right questions
- Collecting the data
- Transforming the raw data in to the format required applying Data munging techniques
- Exploring Data by using EDA techniques
- Advanced Exploratory data analysis.
- Building model and perform model assessment
- Presentation and Automation
1 Describing the data problem by asking the right questions
When the user presents their question, for example “What are my expected findings after the project is finished?”, or “What kind of information can I extract through the data science process?,” different results will be given. Therefore, asking the right question and setting a research goal is essential in the first place, for the question itself determines the objective and target of the data science project.
## Examples of specific questions ?

#  - For future farming technique for a specified plant which treatment condition gives the largest plant yields on average

#  - Which web-site design is most viewed by customers  ?

#  - What will the temperature be next Thurseday ?

#  - What will my fourth quarter sales in region C be ?

#  - Which viewers like the same types of movies?

#  - Which plant is in this image ?

#  - What will be the Share price next month ?
2 Collecting the data
Next step is to collect the relevent data from the data source. The collected data is known as raw data. The data can be extracted by file IO, JDBC/ODBC or using web crawler. The data is collected from the conerned stakeholders over a period of time and may be unstructured/raw format.
3 Data munging or Data Preparation
The next step is data munging (or wrangling), a step to help map raw data into a more convenient format for further processing. During this step, there are many processes, such as data parsing, sorting, splitting, merging, filtering, missing value completion, and other processes to convert and organize the data, and enable it to fit into a consumable structure. Later, the mapped data can be further used for data aggregation, analysis, or visualization. This step involves Data Cleansing, Data tranformation and combining data. For example during the cleansing process it is necessary to check for null values, during transformation it is necessary to combine and reduce number of variables, combing data includes creating data views and merging or joining data sets. Once data is clean we look for statistical properties such as distributions,correlations, and outliers.
Common data errors found during this phase are
- Mistakes during data entry
- Redundant white space: Present of white spaces
- Impossible values: values which are not possible in the given context
- Missing values: features or data not labeled or having null values
- Outliers: Data points that are significantly spread out by the majority of the observations
For example to detect outliers statistical methods such as IQR and boxplot is used. Describe the data as unimodal, bimodal, multimodal; symmetric, right-skewed, left-skewed to find out the outliers.
4 Exploring Data by using EDA techniques
After the data munging step, users can do further analysis toward data processing. The most basic analysis is to perform exploratory data analysis. Exploratory data analysis involves analyzing a datamatrix by summarizing its characteristics. Performing basic statistical, aggregation, and visual methods are also crucial tasks to help the user understand data characteristics, which are beneficial for the user to capture the majority, trends, and outliers easily through plots. Basic exploratory analysis includes creating simple graphs, combined graphs and summarising the findings based on the graphs.
Experimental Data Analysis is a process of looking at a data set to see what are the appropriate statistical inferences that can possibly be learned. For univariate data, we can ask if the data is approximately normal, longer tailed, or shorter tailed? Does it have symmetry, or is it skewed? Is it unimodal, bimodal or multi-modal. The main tool is the proper use of computer graphics.
barplots for categorical data
histogram, dot plots, stem and leaf plots to see the shape of numerical distributions
boxplots to see summaries of a numerical distribution, useful in comparing distributions and identifying long and short-tailed distributions.
normal probability plots To see if data is approximately normal
5 Advanced exploratory data analysis
Until now, the descriptive statistic gives a general description of data features. However, one would like to generate an inference rule for the user to prepare and predict data features based on input parameters. Therefore, the application of machine learning enables the user to generate an inferential model, where the user can input a training dataset to generate a predictive model. After this, the prediction model can be utilized to predict the output value or label based on given parameters.
Example: Applying anova to plantgrowth dataset
require(stats); require(graphics)
boxplot(weight ~ group, data = PlantGrowth, main = "PlantGrowth data",
        ylab = "Dried weight of plants", col = "lightgray",
        notch = TRUE, varwidth = TRUE)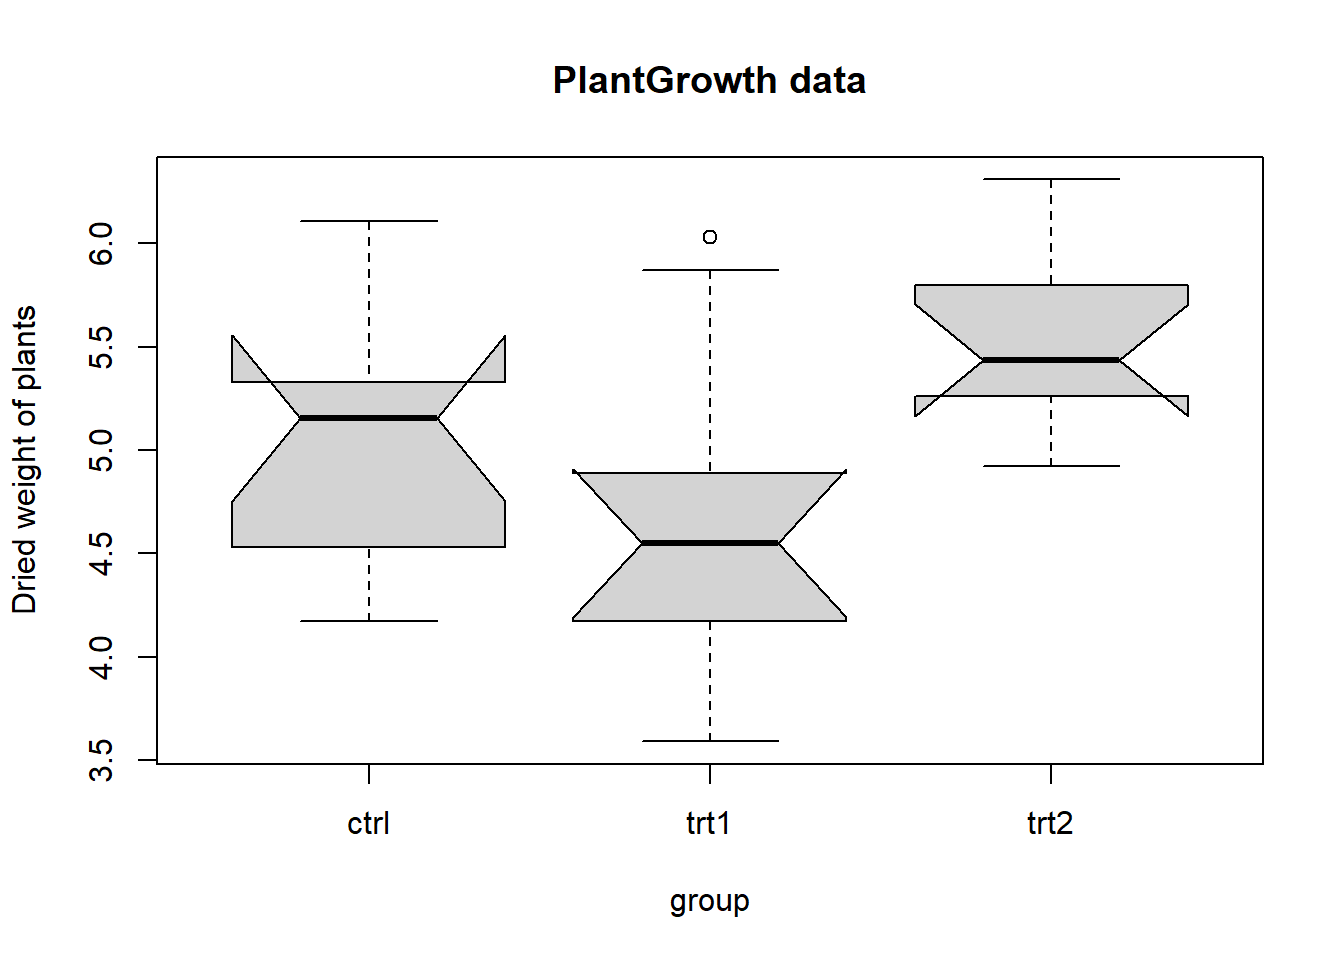
anova(lm(weight ~ group, data = PlantGrowth))## Analysis of Variance Table
##
## Response: weight
## Df Sum Sq Mean Sq F value Pr(>F)
## group 2 3.7663 1.8832 4.8461 0.01591 *
## Residuals 27 10.4921 0.3886
## ---
## Signif. codes: 0 '***' 0.001 '**' 0.01 '*' 0.05 '.' 0.1 ' ' 16 Model building and assessment
To assess whether the generating model performs the best in the data estimation of a given problem, one must perform a model selection. The selection method here involves many steps, including data preprocessing, tuning parameters, and even switching the machine learning algorithm. However, one thing that is important to keep in mind is that the simplest model frequently achieves the best results in predictive or exploratory power whereas complex models often result in over fitting.
Example: Simple prediction using confidence and prediction intervals
## Predictions
x <- rnorm(15)
y <- x + rnorm(15)
predict(lm(y ~ x))
## 1 2 3 4 5 6
## -0.36009109 0.29371013 -0.48299385 0.41040803 -0.79264920 0.48202120
## 7 8 9 10 11 12
## -1.09880633 1.46861132 -0.17694752 0.08175668 0.69344918 -0.09737301
## 13 14 15
## -0.08041414 -1.22850839 -1.28577230new <- data.frame(x = seq(-3, 3, 0.5))
predict(lm(y ~ x), new, se.fit = TRUE)## $fit
## 1 2 3 4 5 6 7
## -2.5612040 -2.1602152 -1.7592264 -1.3582375 -0.9572487 -0.5562598 -0.1552710
## 8 9 10 11 12 13
## 0.2457178 0.6467067 1.0476955 1.4486844 1.8496732 2.2506620
##
## $se.fit
## 1 2 3 4 5 6 7 8
## 1.0532103 0.8947742 0.7401636 0.5923814 0.4580845 0.3530148 0.3086255 0.3489015
## 9 10 11 12 13
## 0.4517377 0.5850248 0.7323205 0.8866706 1.0449539
##
## $df
## [1] 13
##
## $residual.scale
## [1] 1.195184pred.w.plim <- predict(lm(y ~ x), new, interval = "prediction")
pred.w.clim <- predict(lm(y ~ x), new, interval = "confidence")
matplot(new$x, cbind(pred.w.clim, pred.w.plim[,-1]),
lty = c(1,2,2,3,3), type = "l", ylab = "predicted y")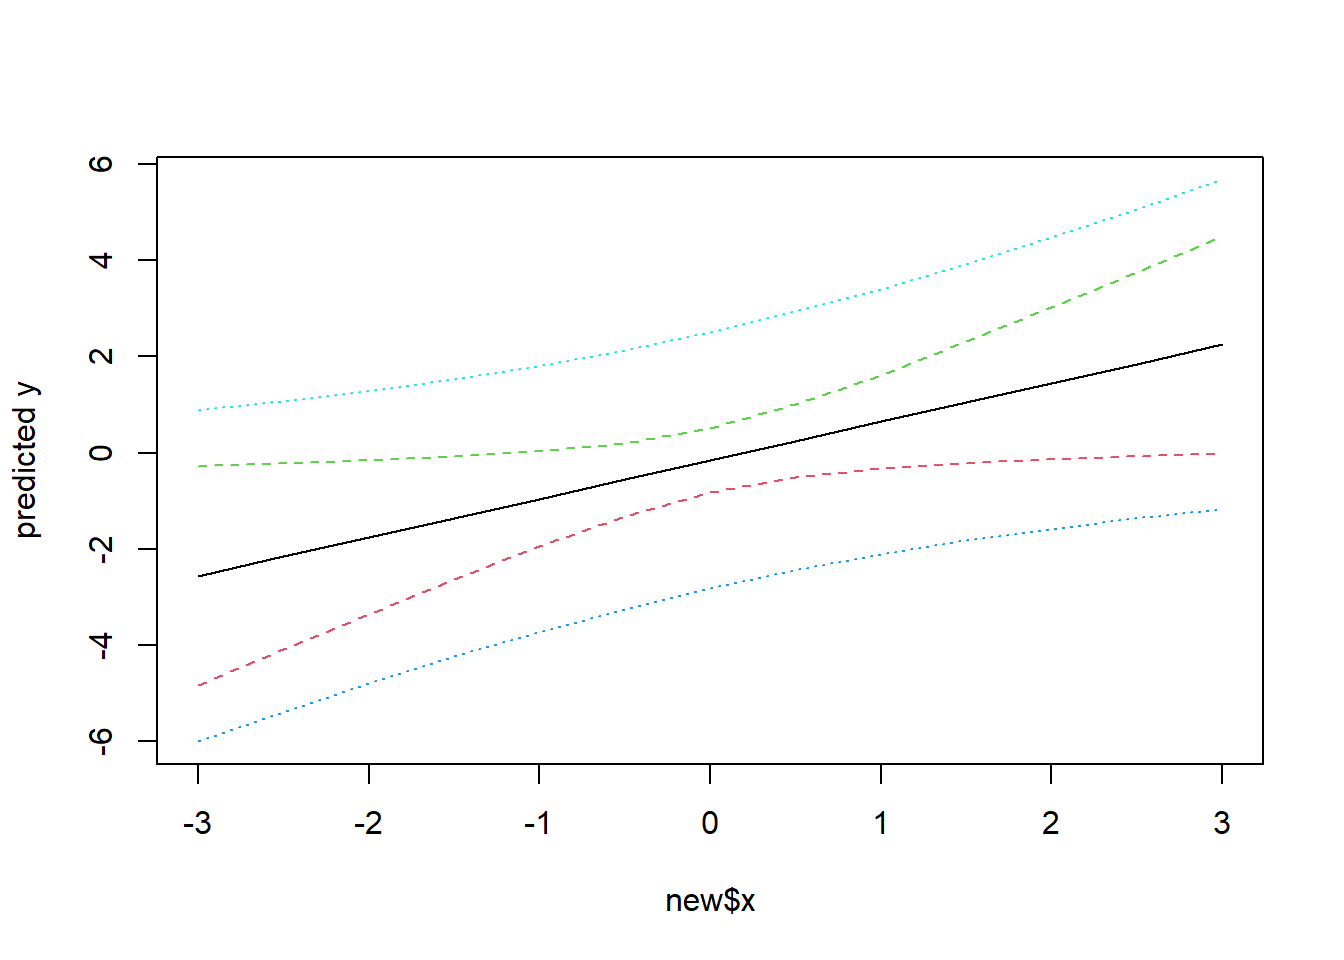
7 Presentation and Automation
Finally,The last step of the data science model is presenting your results and automating the analysis, if needed. One goal of a project is to change a process and/or make better decisions. We may still need to convince the business that our findings will indeed change the business process as expected. This is where we can shine in as influencer role. The importance of this step is more apparent in projects on a strategic and tactical level. Certain projects require to perform the business process over and over again, so automating the project will save time.