Decision Trees
Decision trees area tree-like tool which can be used to represent a cause and its effect
Decision trees
Decision trees area tree-like tool which can be used to represent a cause and its effect. In Machine Learning Decision trees are a type of Supervised machine learning where data is split according to given parameter while constructing a tree to solve a given problem. In decision tree there is a predictor variable and target variable or the desired output. The predictor variable could be anything such as technical indicators etc and the target variable could be desired output for example whether to invest in a given financial security or not.
How it works
A decision basically gives flowchart of how to make some decision.You have some dependent variable, like whether to buy the stock depending on factors like RSI, MACD etc. When you have a decision like that that depends on multiple attributes or multiple variables, a decision tree could be a good choice.
There are many different aspects of the weather that might influence my decision to buy a given stock. It might have to do with the stock closing prise today, the RSI,MACD, EMA etc. A decision tree can look at all these different features of the stock, and decide what are the thresholds. What are those factors which affects the stock movement.
For example, Factors affecting the stock movement is shown by using decision tree
Understanding Decision Tree
At each iteration of the decision tree flowchart, we find the property that we can partition our data on which minimizes the entropy of the data at the next step. So we have a resulting set of classes in this case “BUY” or “SELL”, and we want to choose the attribute decision at that step that will minimize the entropy at the next step. So we just walk down the tree, minimize entropy at each step by choosing the right attribute to decide on, and we keep on going until we run out.
The decision to buy the stock in majority of the cases is dependent on the stock fundamentals. In 64% of the cases buying of stock is supported by decision tree if the fundamentals of the company are strong.
Decision tree example
Let’s say I want to build a system that will automatically predicts the stock movement at the end of the day based on the opening price of the stock. Given a stock the system should decide whether that stock is going to have upward movment or downward movement during intraday trading so that investor can make a decision of investment in that stock.
So let’s make some totally fabricated stock data that we’re going to use in this example:
In the preceding table, we have stock prices along with technical indicators. We are going to pick some attributes that we think might be interesting or helpful to predict whether or not they can predict movement of the stock (UP or DOWN). How much is William %R ? What is exponential moving average ? What is the value of stochastic momentun index ? Is the stock overbought/oversold (RSI) ? Depending on the factors which affect the stock price we can predict whether it will go up or down.
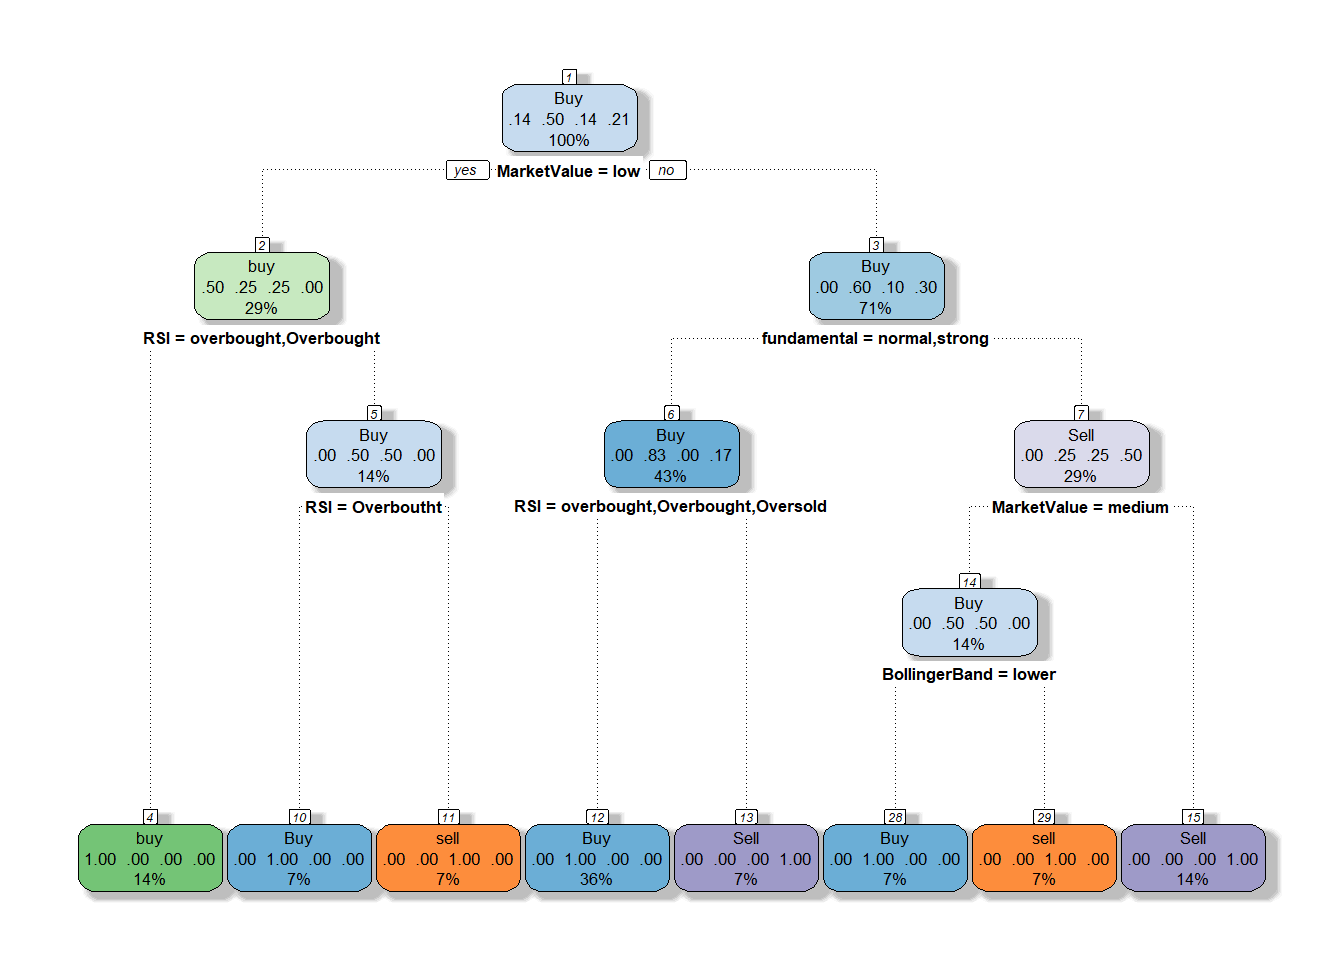
Now, obviously there’s a lot of information that isn’t in this model that might be very important, but the decision tree that we train from this data might actually be useful in doing an initial pass at weeding out some candidates. What we end up with might be a tree that looks like the following:
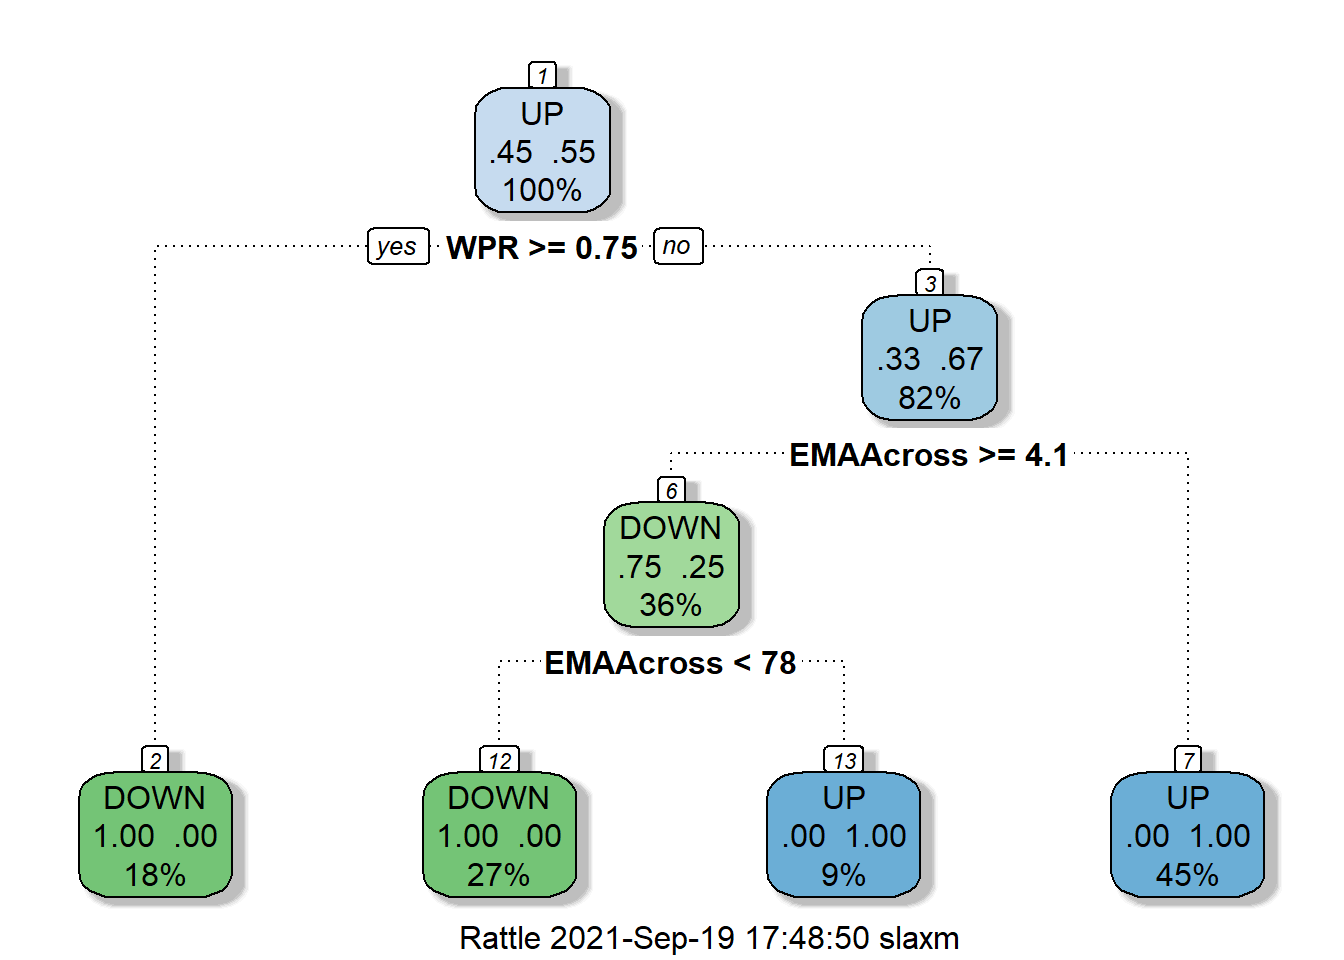 So it just turns out that in totally fabricated data, if the william %R (WPR) is below 0.17 then the stock will go UP. So the first questioon decision tree related to WPR, i.e if WPR is above 0.17 then go to left. At node 2 check if the exponential moving average is above 9.7, if it is then we end up at the leaf node predicted value to stock going down. If at node 2 exponential moving average is below 9.7 then go to node 5 and check the value of stochastic mementun index, if it is above 42 then go to right at leaf node 11 having stock predicted value of UP and so on.
Walking through a decision tree
So that’s how we walk through the results of a decision tree. It’s just like going through a flowchart, and it’s kind of awesome that an algorithm can produce this for us. The algorithm itself is actually very simple. Let me explain how the algorithm works.
At each step of the decision tree flowchart, we see the attribute that we can partition our data on that minimizes the entropy of the data at the next step. So we have a resulting set of classifications in this case UP or DOWN, and we want to choose the attribute decision at that step that will minimize the entropy at the next step.
Entropy meausures the level of impurity in a group. The group having minimum entropy is helps determinie attribute most useful for descriminating between classes to be learned.
At each step we want to make all of the remaining choices result in either as many downs or as many up decisions as possible. We want to make that data more and more uniform so as we work our way down the flowchart, and we ultimately end up with a set of candidates that are either all UPS or all DOWNS so we can classify into yes/no decisions on a decision tree. So we just walk down the tree, minimize entropy at each step by choosing the right attribute to decide on, and we keep on going until we run out.
There’s a fancy name for this algorithm. It’s called ID3 ( Iterative Dichotomiser 3 ). It is what’s known as a greedy algorithm. So as it goes down the tree, it just picks the attribute that will minimize entropy at that point. Now that might not actually result in an optimal tree that minimizes the number of choices that you have to make, but it will result in a tree that works, given the data that you gave it.
The tree starts at the top and finds the best data to split into nodes. It does this by recursive binary splitting using either the Gini index or cross-entropy measure. The Gini index is defined as:
\[G = \sum_{k=1}^K \hat{p}_{mk}(1 - \hat{p}_{mk})\]
and is also referred as a measure of node purity, i.e., a smaller value indicates a node contains observations primarily from a single class.
Cross-entropy is similar to the Gini index in that it will take a small value if the node is pure. It is defined as:
\[D = -\sum_{k=1}^K \hat{p}_{mk}log\hat{p}_{mk}\]
The Gini index and Cross-entropy measures dictate when a node split will occur in order to keep each node as pure as possible to reduce the total value of the Gini index or cross-entropy measures.
Start at the top, or root of the tree. 57% of the stock movements will have an DOWN movement with 43% going in UPWARD direction. If the William % R rating was equal to or above 0.17, we look left, otherwise you move right. To the right, we see only 17% of values having WPR below 0.17 will have UP movement, so the overall terminal node ends with the bucket having UP stock movement and so on.
Evaluating the Decision Tree Model
       DOWN  UP
 DOWN  231  78
 UP     87 220
The decision tree model have accuracy of 73%.
Benefit of Decision Tree over Neural network
The benefit of using Decision trees over Neural Network are:
They are easy to program.
The top nodes in the tree will give the information about what data affects the prediction.
Trees are interpretable and provide visual representation of data.
Performs faster than Neural Networks after training.
Issues with DT
Now one problem with decision trees is that they are very prone to overfitting, so you can end up with a decision tree that works well for the data that we trained it on, but it might not be that great for actually predicting the correct classification for values that it hasn’t seen before. Decision trees are all about arriving at the right decision for the training data that we gave it, but maybe we didn’t really take into account the right attributes, maybe we didn’t give it enough of a representative sample of values to learn from. This can result in real problems.
So to combat this issue, we use a technique called random forests, where the idea is that we sample the data that we train on, in different ways, for multiple different decision trees. Each decision tree takes a different random sample from our set of training data and constructs a tree from it. Then each resulting tree can vote on the right result.
Now that technique of randomly resampling our data with the same model is a term called bootstrap aggregating, or bagging. This is a form of what we call ensemble learning. The basic idea is that we have multiple trees, a forest of trees, each uses a random subsample of the data that we have to train on. Then each of these trees can vote on the final result, and that will help us combat overfitting for a given set of training data.
The other thing random forests can do is actually restrict the number of attributes that it can choose, between at each stage, while it is trying to minimize the entropy as it goes. And we can randomly pick which attributes it can choose from at each level. So that also gives us more variation from tree to tree, and therefore we get more of a variety of algorithms that can compete with each other. They can all vote on the final result using slightly different approaches to arriving at the same answer.
So that’s how random forests work. Basically, it is a forest of decision trees where they are drawing from different samples and also different sets of attributes at each stage that it can choose between.
Summary
We have a better understanding of decision trees now; why they are being used frequently in predictive modeling, how they are created, and how they can be optimized for best results. Decision trees are a powerful tool for data scientists, but they must be handled with care. All the repetitive tasks are achieved by use of computers (hence the term machine learning), all aspects of the process must be overseen by an experienced data scientist in order to create the most accurate model.